
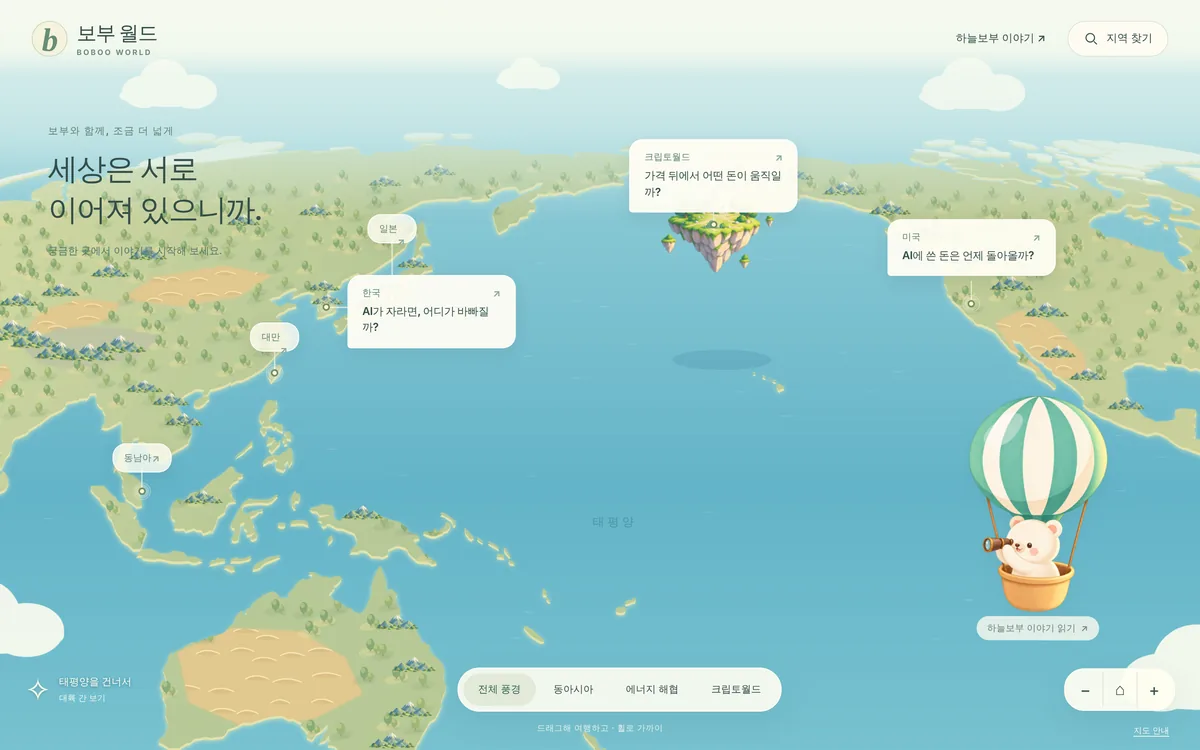
Map
World map
Travel the world map with Boboo. A question floats over each region. Select one to open that region's observatory.

See the world the way you'd see a forest from the sky.
Boboo World observes how the world is moving, using data we collect ourselves. We go beyond summarizing search results and gather raw sources directly, such as satellite imagery, ship tracking data, blockchain ledgers and public filings. Explore the map with Boboo, a bear in a hot-air balloon, and read what we observed in our reports and blog.
Search results alone rarely show how the world is really moving. So Boboo collects real data directly, and plenty of it, and observes it closely. We share what we observe in three ways. Explore it on the map, look closer in the observatories, and read it as stories in the reports and blog.
Map
Travel the world map with Boboo. A question floats over each region. Select one to open that region's observatory.
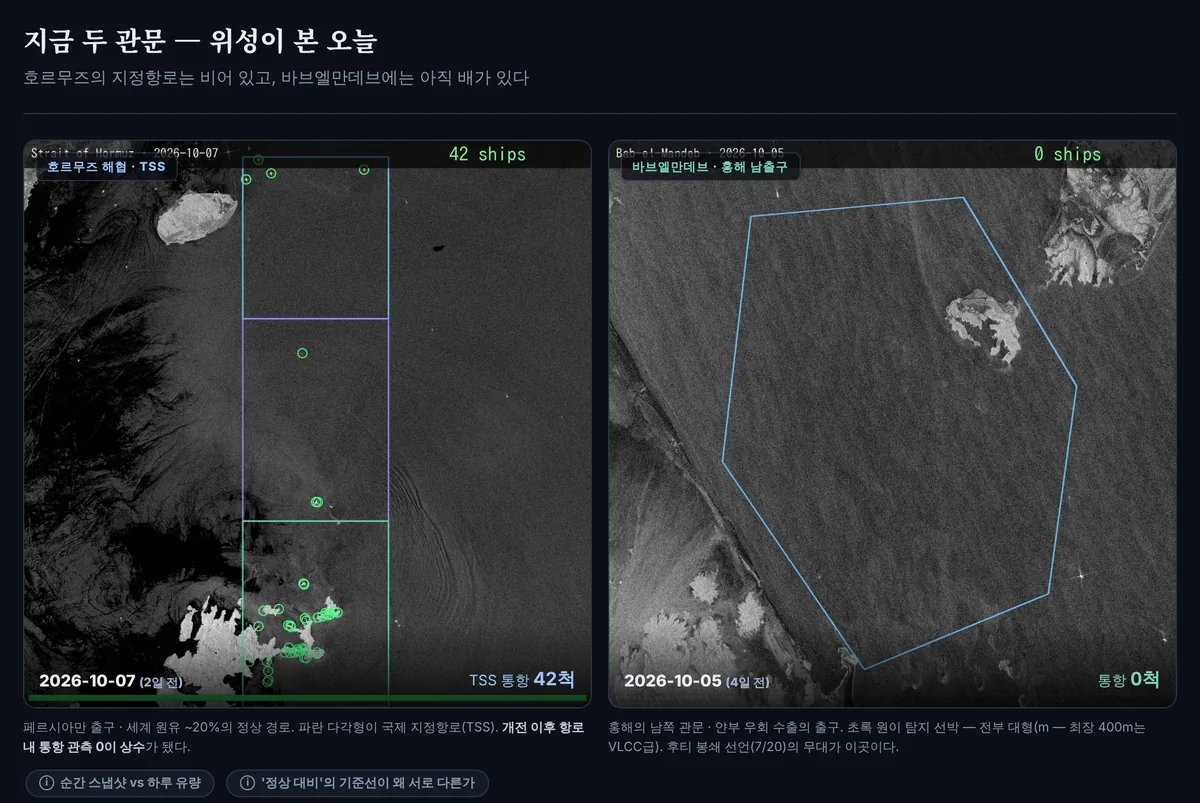
Topic observatories
Each observatory looks closely at a single topic. Shipping lanes through the Strait of Hormuz, the crypto market, and real estate transactions and auctions each get their own.
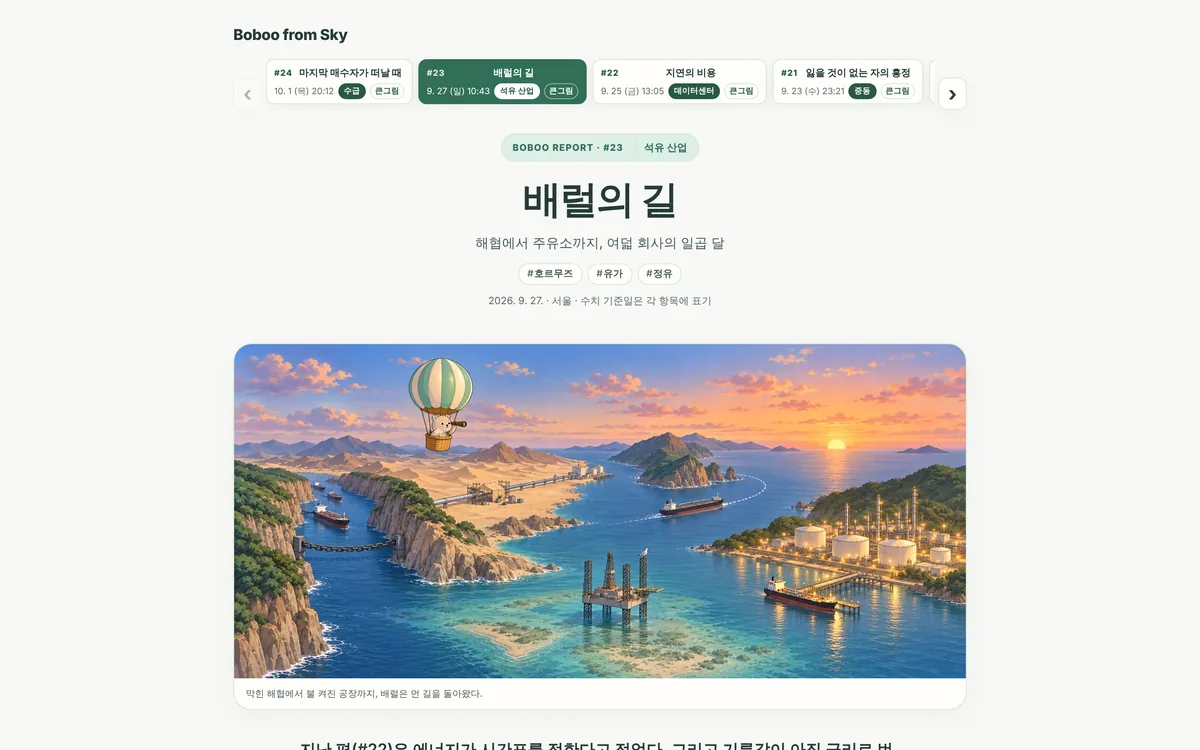
Reports and blog
Observation reports planned, reviewed and published by people. The report site keeps an editor's archive, and Haneul Boboo, our Korean-language blog on Naver, runs an easier-to-read series.
Every observation in Boboo World goes through five stages. We collect the data, refine it, record it in a fixed format and publish it. And like a control tower, we watch over the whole process.
69scheduled jobs
7kinds of raw data
24Boboo from Sky reports
As of 2026-10-09
Raw data we collect ourselves

1 · Raw data collection
We collect raw data such as satellite imagery, ship tracking data, blockchain ledgers, public filings, real estate transaction and auction records, market flows and public interest, macro statistics, and electricity demand. Most of it arrives on a fixed schedule. For markets with opening and closing hours, we wait a short while so prices are settled before we fetch them. We don't collect from sites that block collection in robots.txt, such as property listing sites.
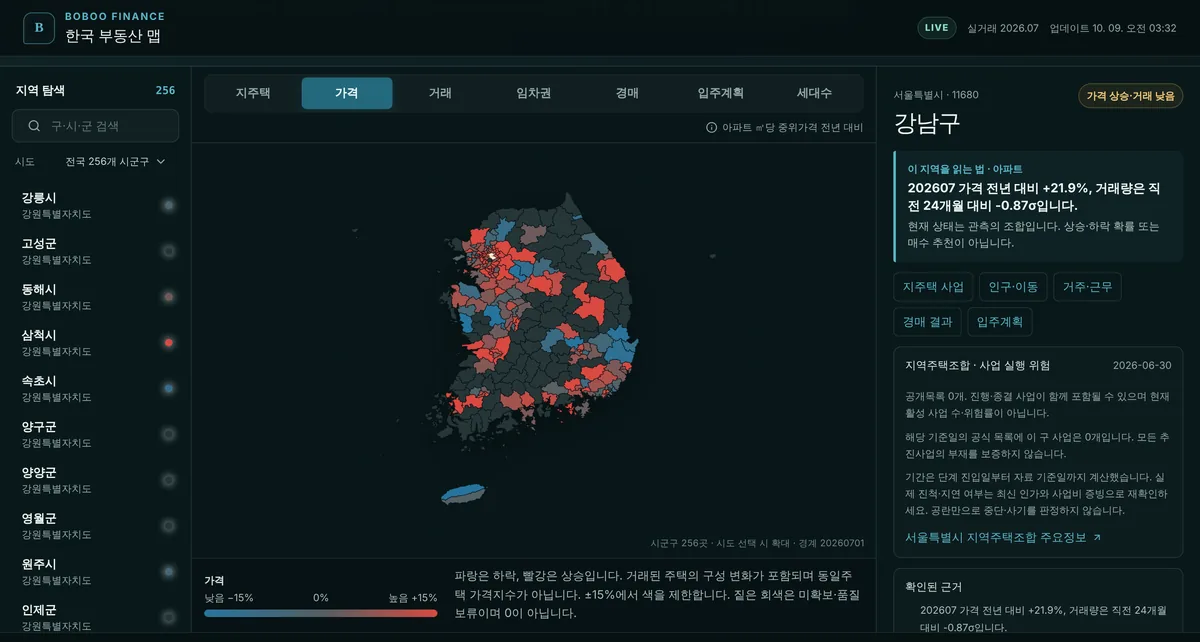
2 · Processing and models
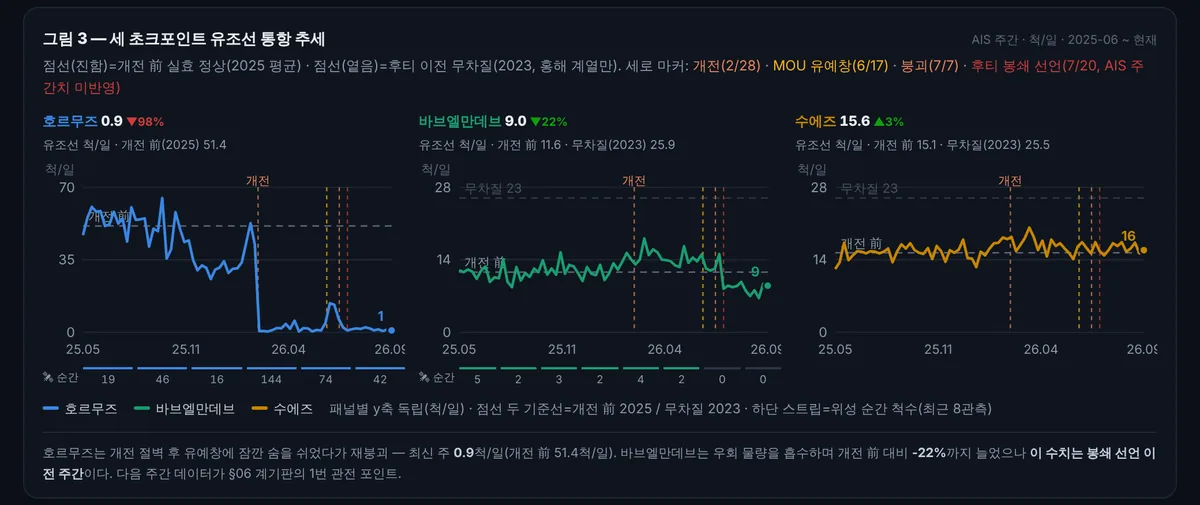
We align units and reference dates so different sources can sit side by side. For example, we count ships passing through a strait from tracking data, then check that count against satellite imagery. When a value can't be obtained, we don't fill it in with an estimate. We leave it blank and note why. On public screens, we show each indicator on its own instead of rolling several into a single score.
3 · Contract
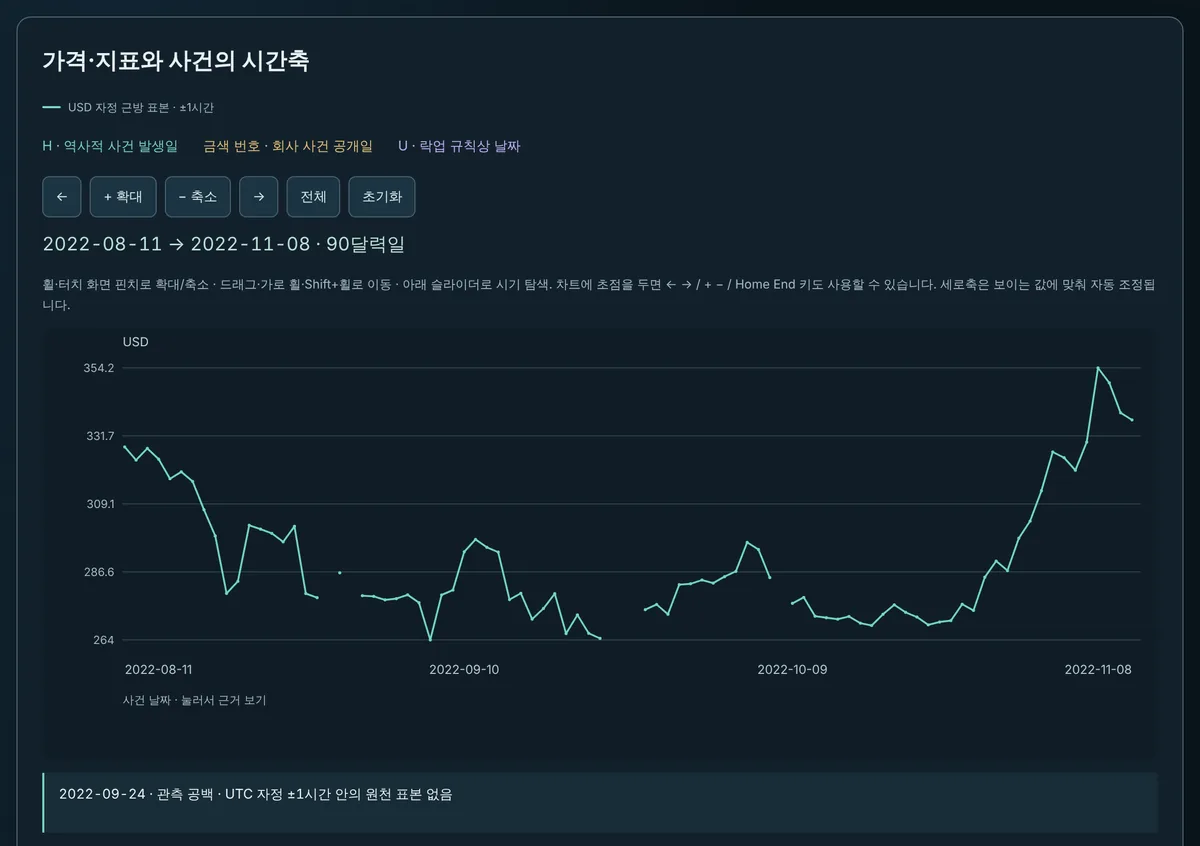
Refined results are saved as result files in a fixed format. We call this agreement a contract. Stages connect to each other only through these files, and we never make duplicate copies of the same result. Each file records the value along with its reference date and, if it is empty, the reason why.
4 · Publishing
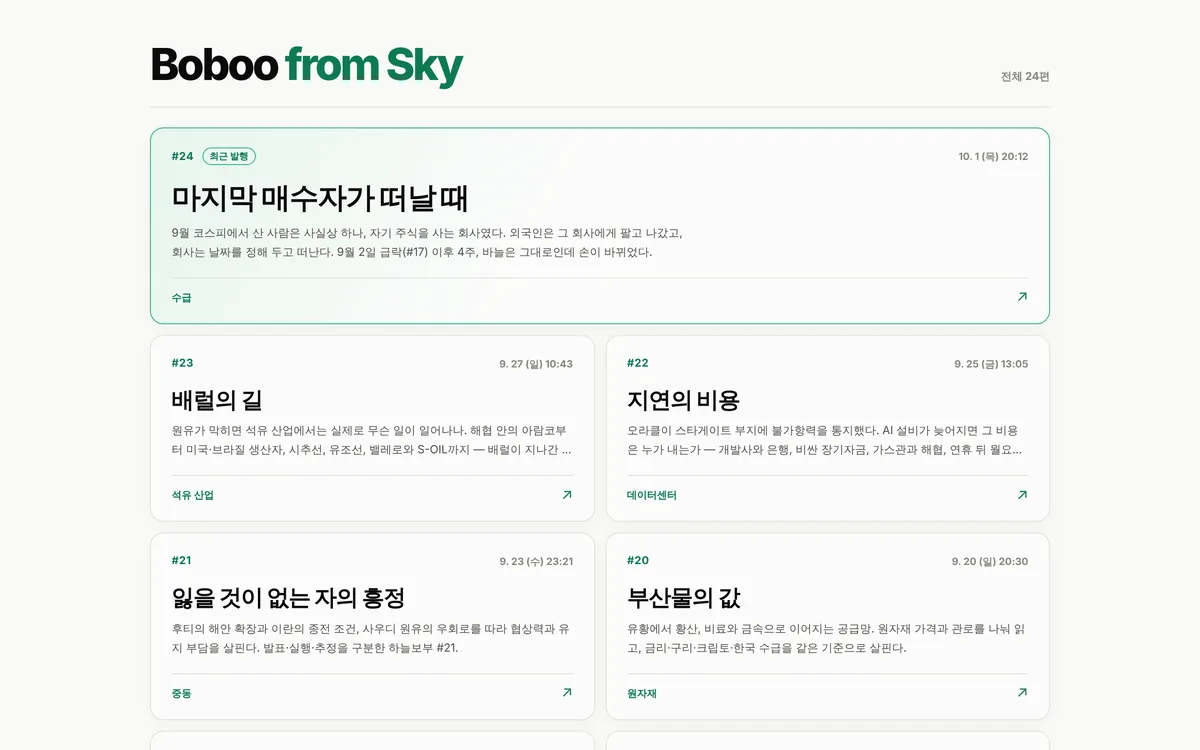
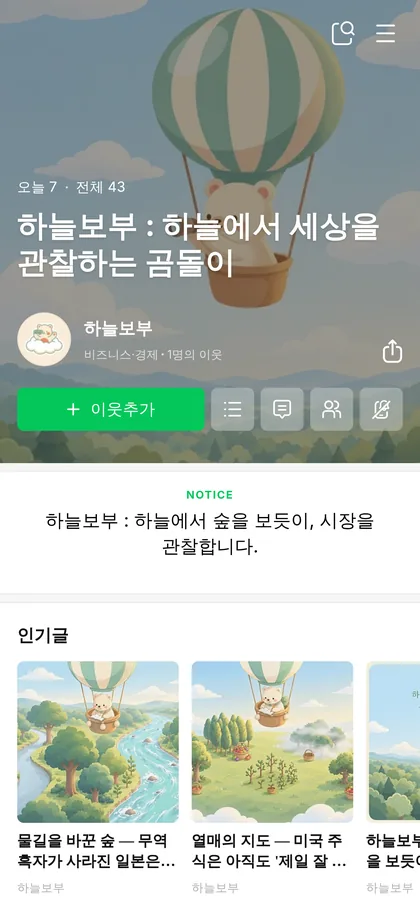
Boboo from Sky reports are planned, reviewed and published by people. Before an issue goes out, we check every number in it against its source, one by one. The Haneul Boboo blog retells the reports in simpler language as an ongoing series. The map and observatories show only the items we have chosen to make public.
5 · Monitoring
Like a control tower, Boboo watches whether result files are refreshed on time. If a job finishes successfully but the values haven't changed, we treat the data as stale. We look for problems based on the oldest file in a set. Changes in the world and failures in the system are watched on separate screens.
Boboo World keeps to seven practices as it observes the world.

Rather than summarizing news articles, Boboo pulls raw data directly. We gather seven kinds of it, from public statistics, market prices and corporate filings to satellite imagery, ship tracking data, blockchain ledgers, and real estate transaction and auction records. That lets us say "here is what we observed" instead of "according to reports."
News of a ceasefire and ships actually moving are two separate things. The Hormuz observatory watches the strait's shipping lanes through satellite imagery and ship tracking data. Tracking data arrives with a delay, so the observation date is shown on screen.
Before writing any interpretation, we record the question. Each question gets at least two competing explanations, and we note in advance which observations would weaken each one. We freeze the evidence we had at the time, and we don't grade past judgments against standards made afterward.
Values we couldn't obtain stay blank, with a note on why. On days the data stops, the chart line stops too. If a fresh read fails, we don't present the previous value as if it were current.
As a rule, we don't edit the text or figures of a published report, because what we knew at the time is itself the record. When a correction is truly needed, it goes through approval, and we keep both the before and after versions.
Like seeing both the forest and the trees, we connect the big picture and individual data points into one story. Each report answers three questions. What happened today? What should we watch next? What is the bigger picture? Questions left open by one issue are picked up by the next.
Travel the map like a game, and open an observatory wherever you're curious. Each observatory gathers the reference date, indicators, charts, limits, next checks and sources on one screen. Like reading the panels in a control tower, you look at every region through the same frame.
Boboo World is a web app where you find observatories on a world map. Boboo travels across the screen with you in a hot-air balloon, and a question floats over each region.
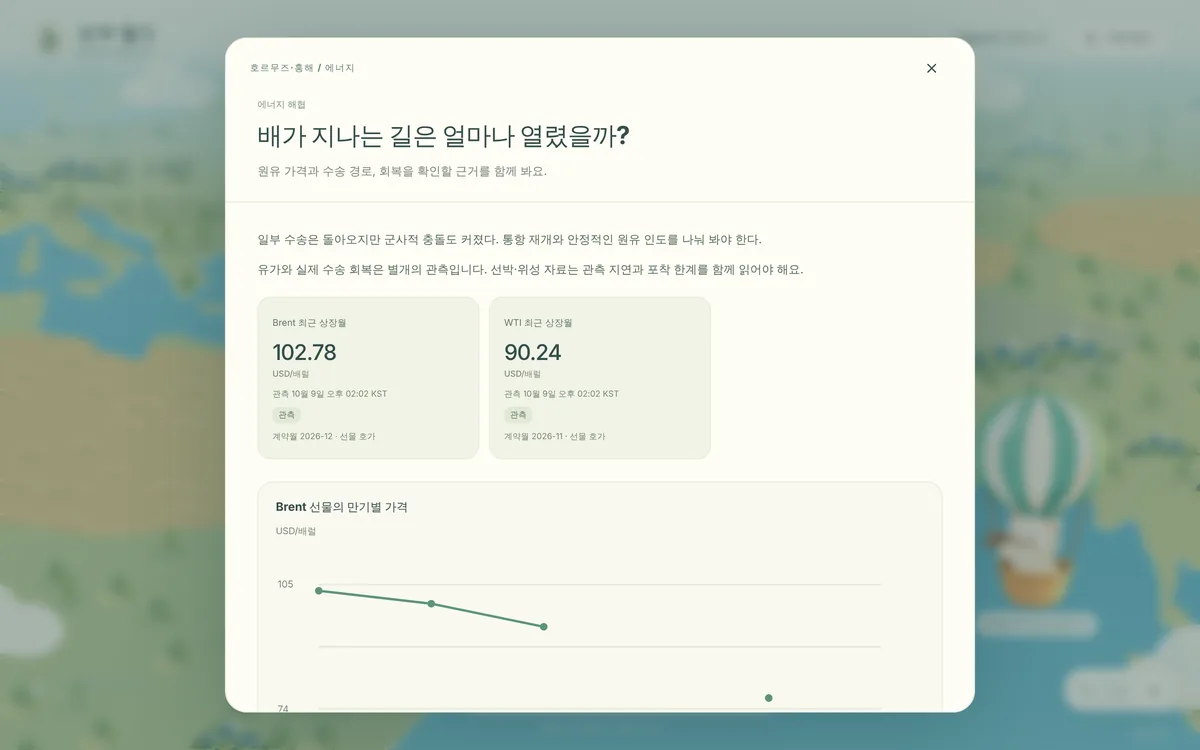
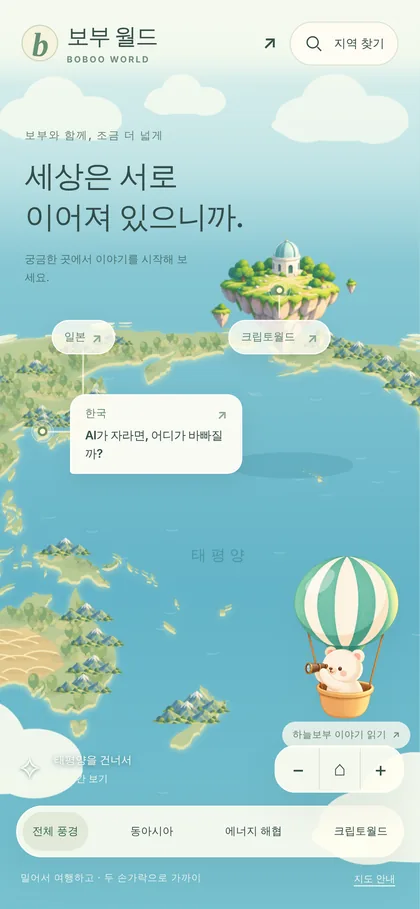
As you drag the map around, you'll see a question bubble over each region. Over Hormuz and the Red Sea, it asks, "How open are the shipping lanes?" Select the question to open that region's observatory.
Select Boboo to open a Haneul Boboo story in a new tab. Crypto World is an imaginary island floating over the Pacific, and the sandy deserts and white snowfields are simple sketches of each region's character. These landscapes don't represent weather or market data.
You can explore with a mouse, a keyboard or touch. If the map is hard to use, you can open the same observatories from a list of regions. Turn on your device's reduce motion setting, and Boboo's swaying and flying animations stop.
No sign-up or login needed. A single cookie in your browser remembers only the last landscape you visited and the starting region you chose. We don't store your real location or visit history. If you block cookies, you can still explore the map.
Work in progress
Nothing in this section is finished yet. It describes where Boboo World is headed, and the details and order may change.
Collecting lots of data doesn't lead to good judgment on its own. We want Boboo to practice using knowledge through philosophy, history and debate. As a starting point, we already write down competing explanations, and the conditions that would disprove them, for every question.
We imagine a service that grows with the people who read it, where observations and explanations go deeper around what each reader is curious about. When we build this, we'll tell you up front what it remembers.
You can already move from the map to observatories and reports. Next, we want to link the map, observatories, reports and blog into one continuous flow. The goal is that reading one observation leads naturally to the next.
We'll keep adding regions and topics to the map. Korean real estate, Europe and China are planned next. We also want to draw lines between regions and topics, to show how a change in one place flows on to others like a river.

Boboo World, including its map, observatories, Boboo from Sky reports and the Haneul Boboo blog, is operated by Bobooism (Boboo Studio) for informational purposes only.
Nothing in Boboo World is investment advice or a solicitation to invest. We do not recommend buying or selling any particular asset or security. You are solely responsible for your investment decisions and their outcomes.
Each dataset has its own observation date and coverage. Some data arrives late or is observed only for sampled periods, and some values may be missing. Bobooism works to present data accurately but does not guarantee the accuracy or completeness of the source data. Past observations and interpretations do not guarantee future results.
The landscapes and character drawings on the map are illustrations. They do not represent weather or market data.
Drafts of the reports and blog posts are written with the help of AI tools and reviewed by people before publication. The illustrations were made with the help of generative image tools.
Contact: hello@bobooism.com